Insights
Real-time sales dashboard for data-driven decisions
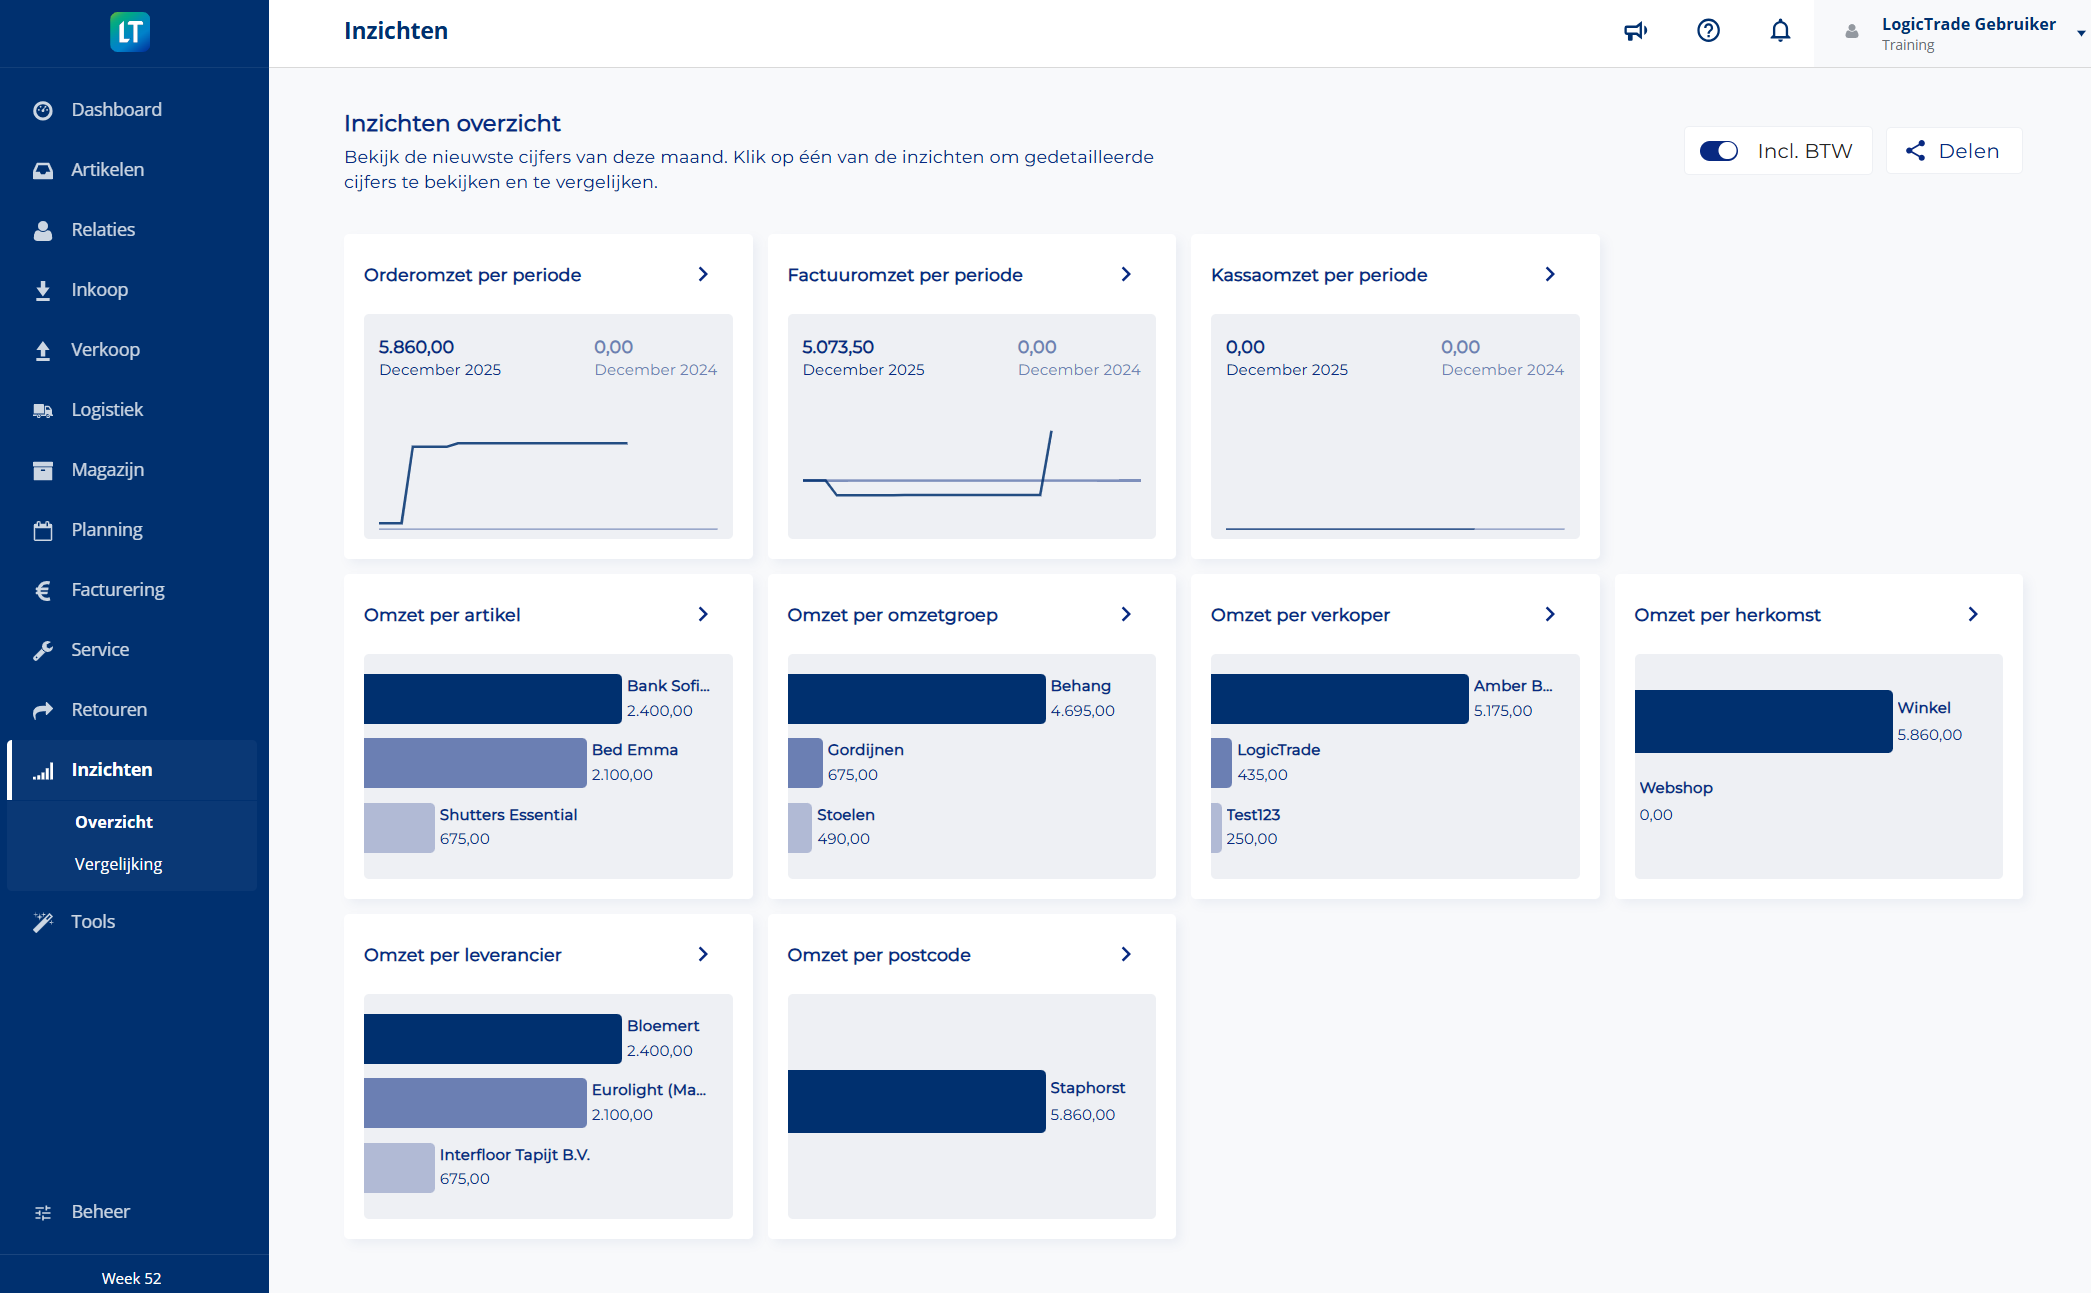
Your sales figures come to life
Say goodbye to time-consuming reports and endless Excel files. With Insights you transform your business data into immediately actionable information for your home furnishing store.
Monitor your revenue development live, compare performance with historical trends and dive deep into your store performance. Insights gives you instant answers to your most important questions:
- How are your different product groups performing?
- Where does your revenue come from?
- Which salespeople on your team are exceeding their targets?
Get started immediately
You will find Insights directly in your familiar LogicTrade menu bar. An interactive tour guides you through all features, so you experience the power of data-driven decisions within minutes.
With one click on 'overview' a world of possibilities opens up. Discover trends, spot opportunities and adjust where needed - all from your personal dashboard.
Problems that Insights solves
- Reports take hours - Gathering data from different sources, creating Excel files, manually analysing
- Decisions based on gut feeling - No current figures available so making decisions on intuition
- No visibility on trends - Only discovering afterwards that a product group has been declining for months
- Sales performance unclear - Who is performing well, who needs support? No idea
- Data in silos - Revenue figures scattered across POS system, accounting and Excel
- Adjusting too late - Only flagging problems after the damage is done
Benefits of Insights
📊 Real-time overview
No waiting for monthly reports. See immediately how your store is performing - today, this week, this quarter.
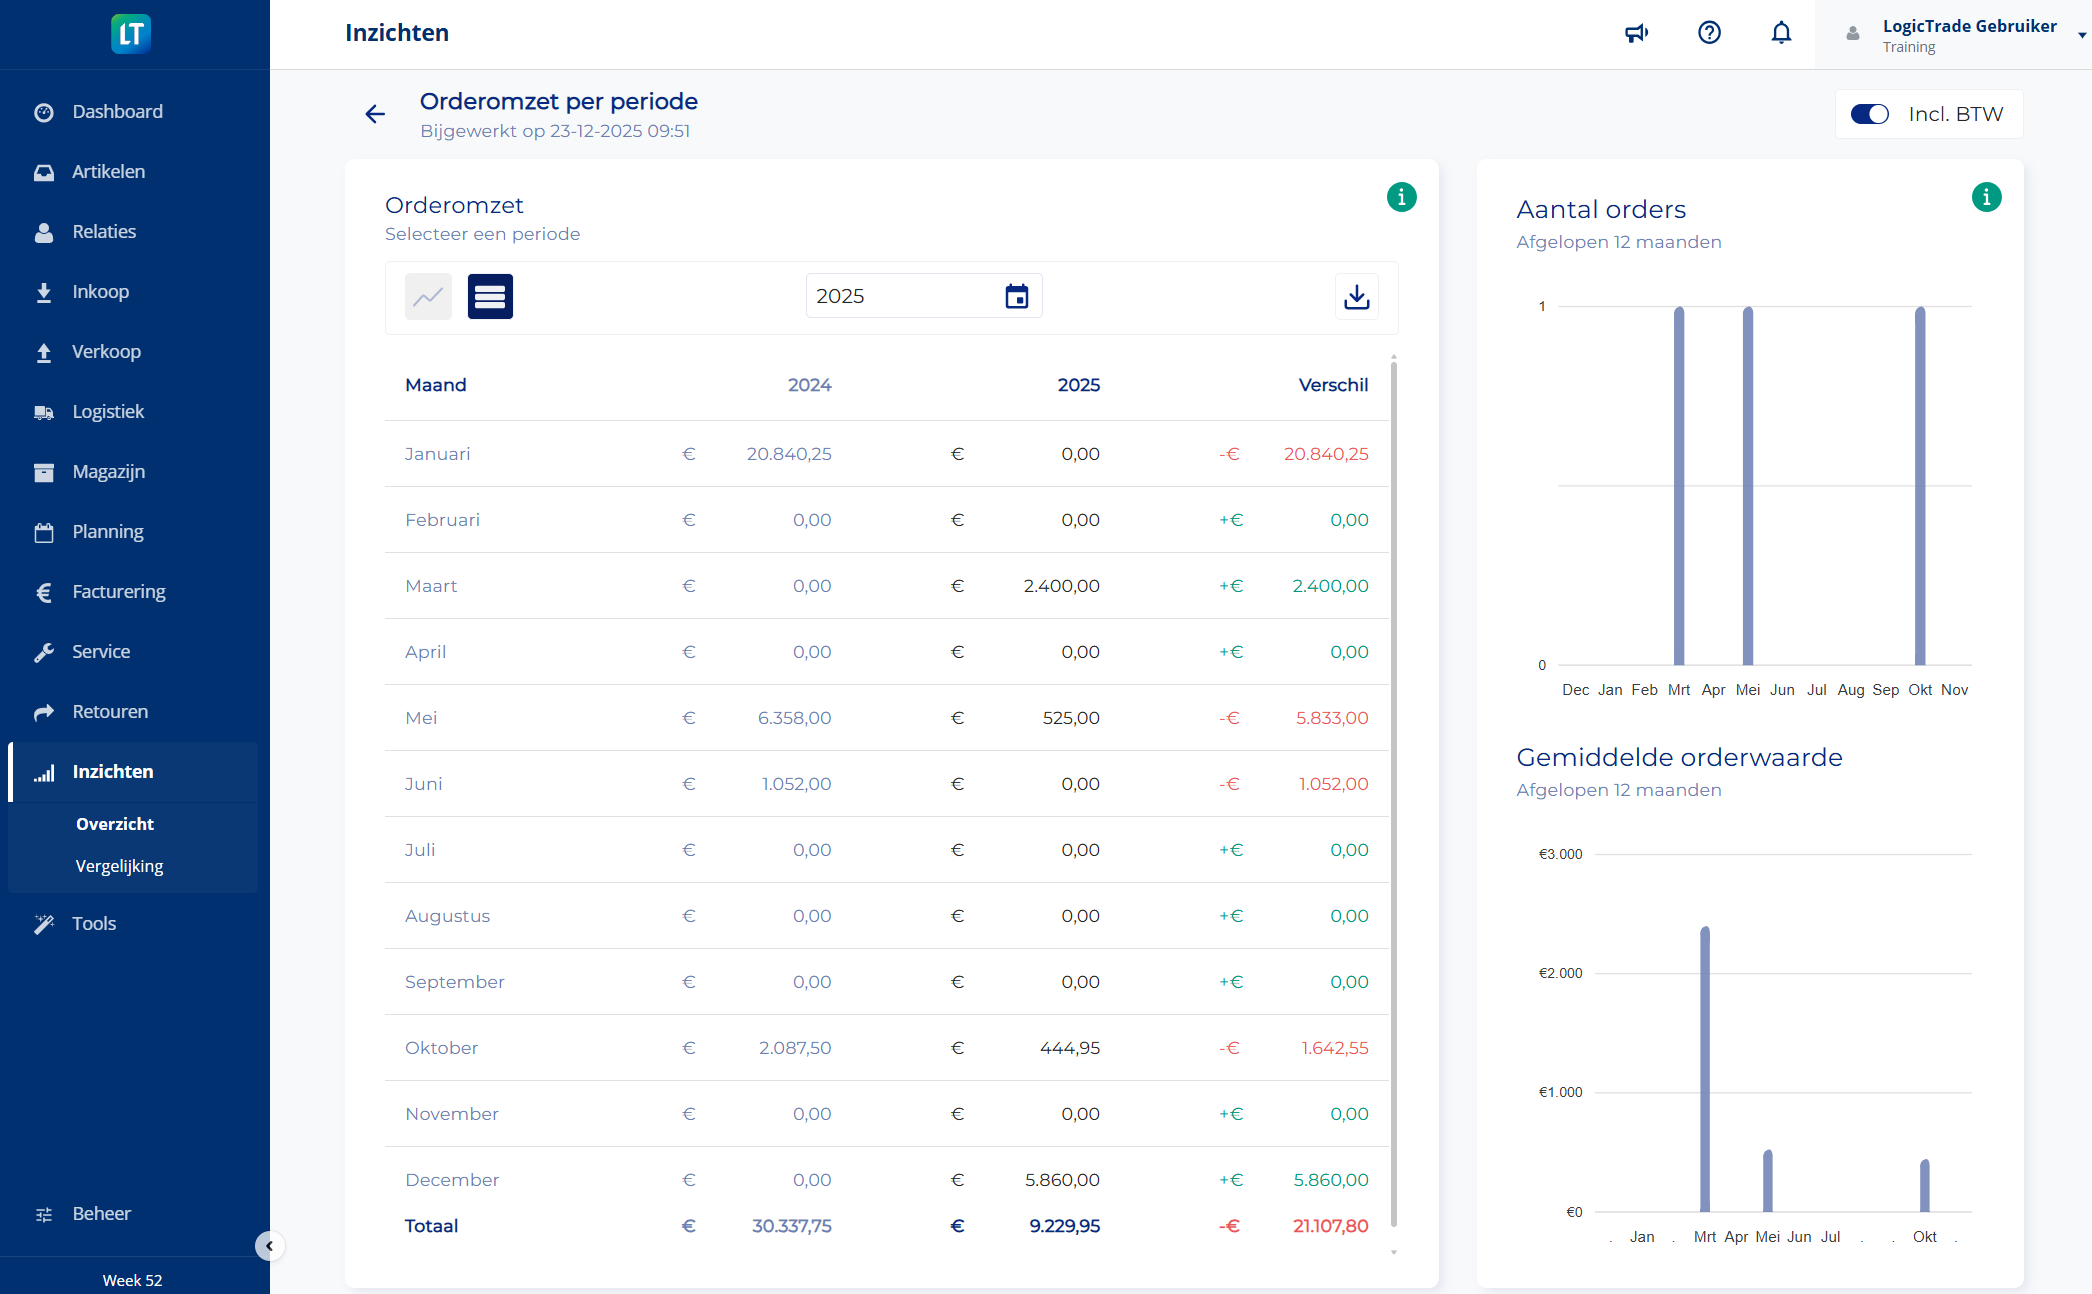
📈 Historical comparisons
Compare performance with last year, last month or any desired period. Spot trends before it is too late.
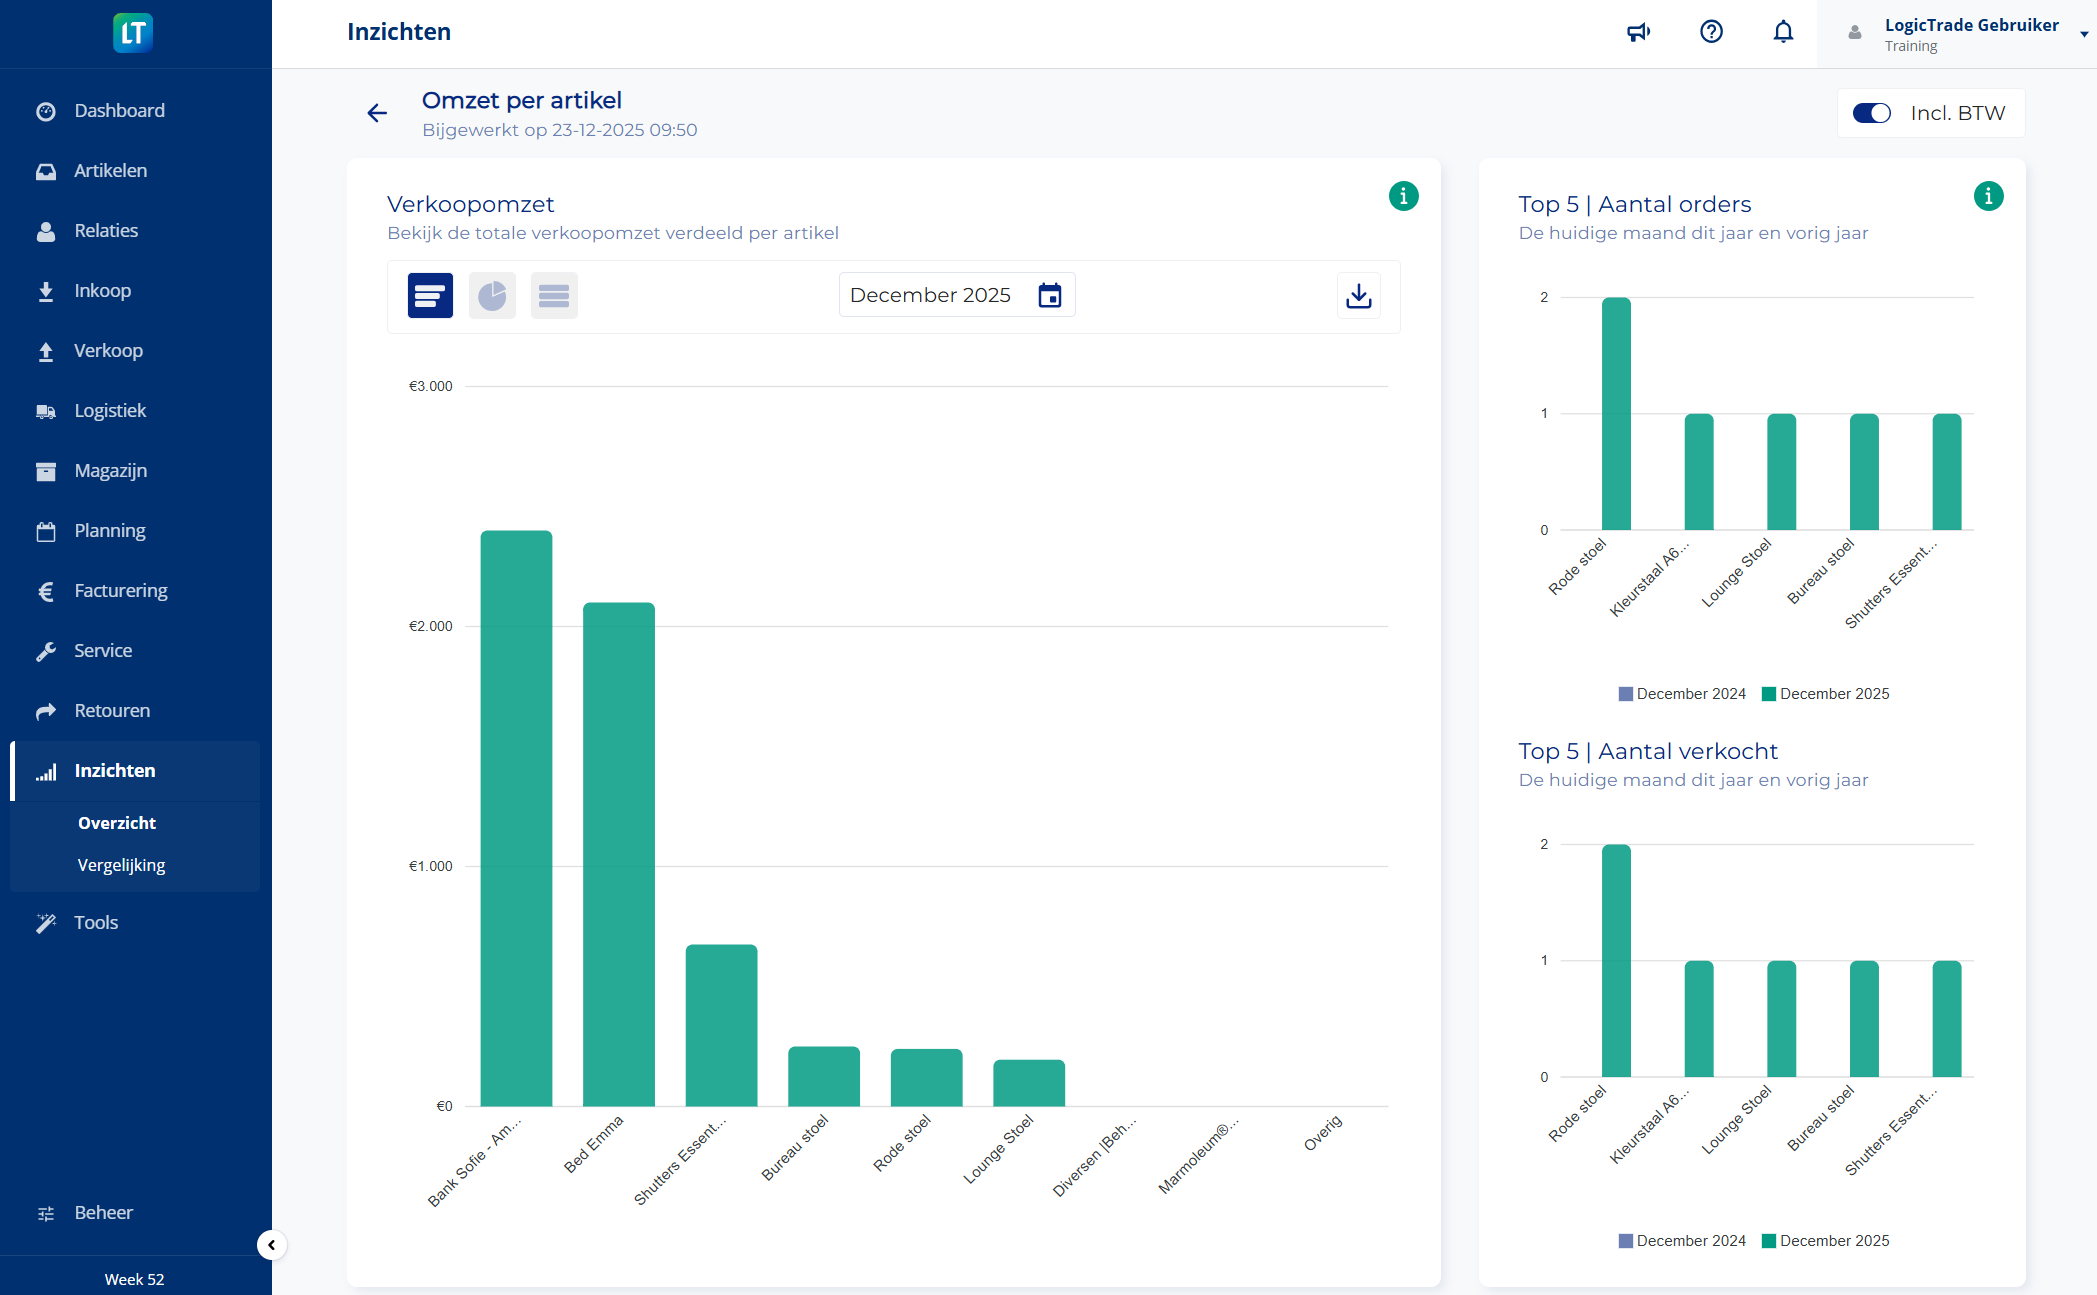
🏷️ Product group analysis
Which categories are growing, which are declining? Insights shows performance per product group at a glance.
👥 Sales performance
Who is exceeding targets, who needs coaching? Motivate your team with transparent performance insights.
🎯 Data-driven decisions
Stop guessing, start with facts. Every decision backed by current sales data.
🚀 Interactive tour
No manual needed. The built-in tour guides you through all features within minutes.
How does Insights work?
Open Insights
Click on 'Insights' in your LogicTrade menu bar. The dashboard opens directly with your current sales data.
Start the tour
First time? The interactive tour guides you step by step through all features. Experiment with sample data.
Explore your data
Dive into revenue trends, compare periods, analyse product groups and view sales performance.
Take action
Spot opportunities and bottlenecks. Adjust where needed and follow the results in real-time on your dashboard.


Ready to start with Insights?
![]() Included in every LogicTrade plan from €239/month
Included in every LogicTrade plan from €239/month
Discover how Insights can optimize your workflows.