Dashboards
Real-time insight into your business performance
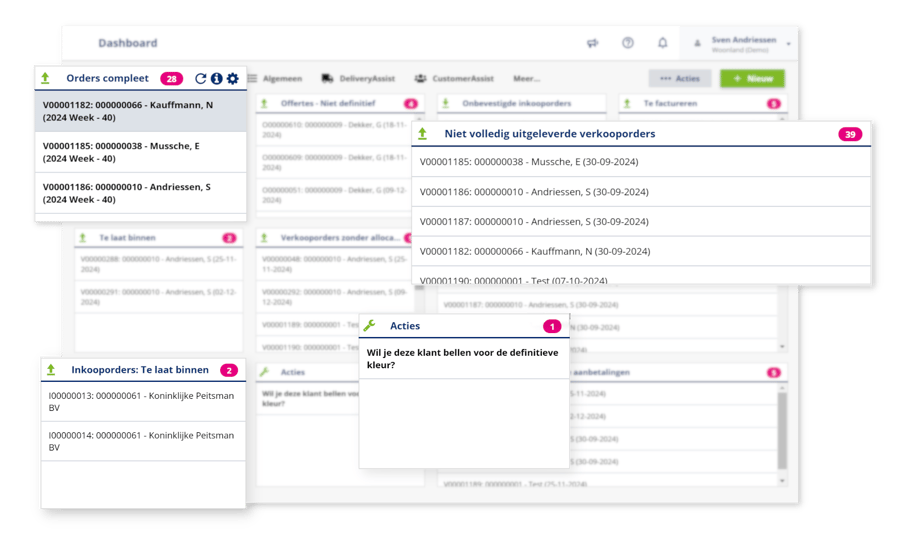
Your business at a glance
How is your business really performing? How many quotes are open? What is the revenue this month? Which orders still need to be delivered? With LogicTrade Dashboards you always have up-to-date insight into the numbers that matter.
No more running reports or updating Excel files. Open LogicTrade and immediately see the status of your business - real-time, clear, and exactly the way you want it.
For yourself and your team
Build your personal dashboard with the tiles that are relevant to you. The owner wants to see revenue figures, the salesperson open quotes, the warehouse employee today's deliveries. Everyone gets their own cockpit.
You can also create shared dashboards for your team. Hang a screen in the store with the sales targets, or show the warehouse dashboard in the stockroom. That way everyone works with the same current information.
Problems that Dashboards solves
- No overview of the business - How is it actually going? Nobody knows for sure without digging for hours
- Running reports takes time - The same Excel exercise every week to gather the numbers
- Outdated information - By the time the report is ready, the figures are already obsolete
- Everyone wants different figures - The owner wants revenue, sales wants quotes, the warehouse wants deliveries
- No shared picture - Every team member has their own Excel with their own version of the truth
- Data is locked away - The information is in the system but difficult to unlock for analysis
Benefits of Dashboards
👤 Personal dashboards
Build your own dashboard with the KPIs that are relevant to you. Drag, arrange and configure as you wish.
👥 Shared team dashboards
Create dashboards for your team or department. Everyone works with the same current figures.
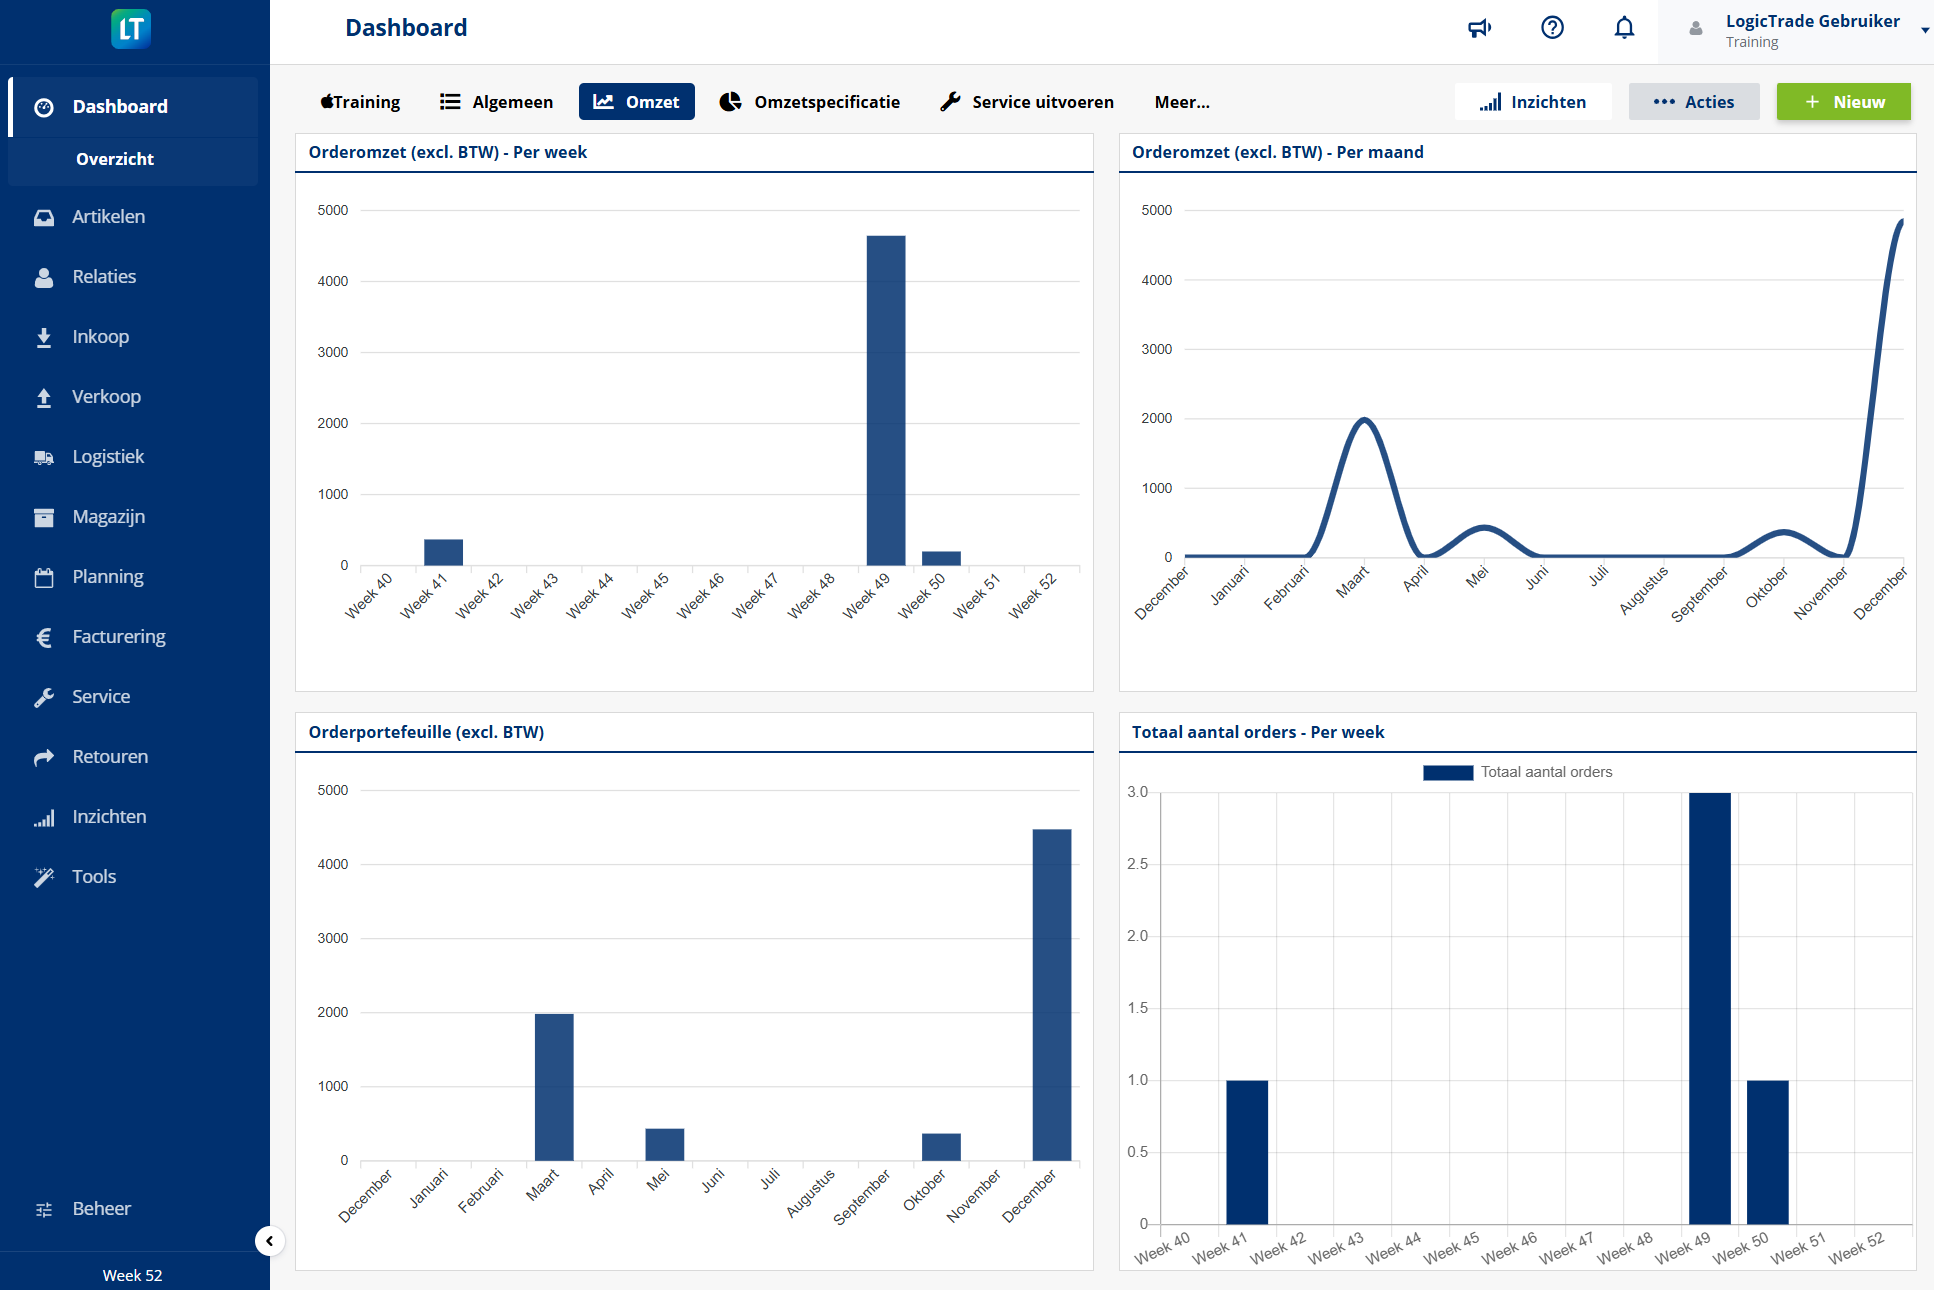
⚡ Real-time data
No outdated reports. Dashboards always show the current state of affairs.
🧩 Flexible tiles
Choose from dozens of dashboard tiles: revenue, quotes, orders, inventory, tasks and more.
📊 Power BI integration
For advanced analytics, connect LogicTrade with Power BI. Unlimited possibilities for data analysis.
📱 Accessible everywhere
View your dashboards at the office, on the go or at home. Via browser or tablet, always available.
How does Dashboards work?
Open the dashboard
After logging in, you immediately see your personal dashboard. This is your start page in LogicTrade.
Add tiles
Click 'Edit' and choose which tiles you want to see. From open quotes to monthly revenue.
Adjust the layout
Drag tiles to the desired position. Make them larger or smaller. Your dashboard, your layout.
Share with team
Make a dashboard shared so colleagues can see it too. Ideal for team goals and KPIs.


Ready to start with Dashboards?
![]() Included in every LogicTrade plan from €239/month
Included in every LogicTrade plan from €239/month
Discover how Dashboards can optimize your workflows.